Premier League predicted table 2026/27
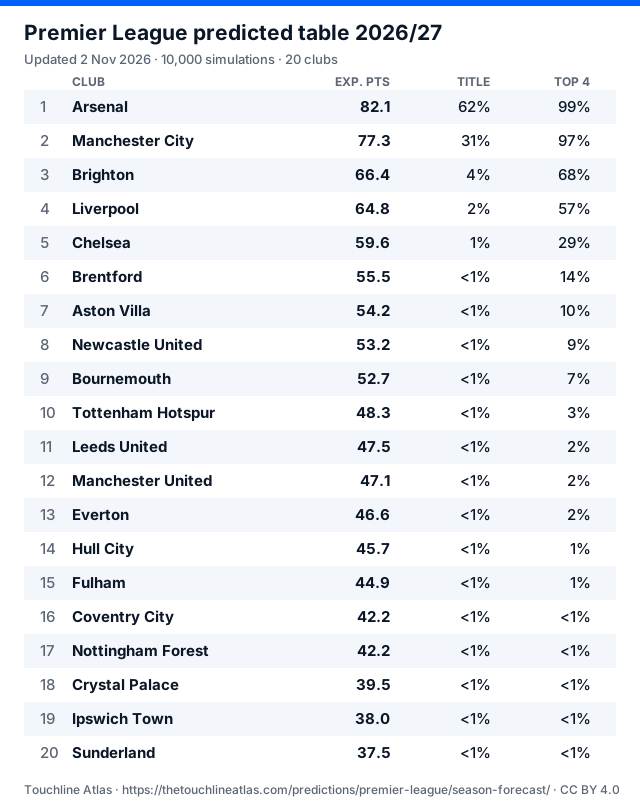
Arsenal are favourites at 62% to win the title. Expected points, title and top-four chances and every finishing position come from 10,000 simulations of the remaining fixtures.
Predicted table
| # | Club | P | Pts | Exp. pts | Title | Top 4 | Relegation |
|---|---|---|---|---|---|---|---|
| 1 | Arsenal | 9 | 24 | 82.1 | 62% | 99% | <1% |
| 2 | Manchester City | 9 | 21 | 77.3 | 31% | 97% | <1% |
| 3 | Brighton | 9 | 19 | 66.4 | 4% | 68% | <1% |
| 4 | Liverpool | 9 | 15 | 64.8 | 2% | 57% | <1% |
| 5 | Chelsea | 9 | 16 | 59.6 | 1% | 29% | <1% |
| 6 | Brentford | 9 | 14 | 55.5 | <1% | 14% | 1% |
| 7 | Aston Villa | 9 | 12 | 54.2 | <1% | 10% | 2% |
| 8 | Newcastle United | 8 | 11 | 53.2 | <1% | 9% | 3% |
| 9 | Bournemouth | 9 | 12 | 52.7 | <1% | 7% | 3% |
| 10 | Tottenham Hotspur | 9 | 12 | 48.3 | <1% | 3% | 9% |
| 11 | Leeds United | 9 | 11 | 47.5 | <1% | 2% | 11% |
| 12 | Manchester United | 9 | 7 | 47.1 | <1% | 2% | 12% |
| 13 | Everton | 8 | 10 | 46.6 | <1% | 2% | 13% |
| 14 | Hull City | 9 | 11 | 45.7 | <1% | 1% | 15% |
| 15 | Fulham | 9 | 9 | 44.9 | <1% | 1% | 18% |
| 16 | Coventry City | 9 | 9 | 42.2 | <1% | <1% | 31% |
| 17 | Nottingham Forest | 9 | 6 | 42.2 | <1% | <1% | 29% |
| 18 | Crystal Palace | 9 | 7 | 39.5 | <1% | <1% | 45% |
| 19 | Ipswich Town | 9 | 11 | 38.0 | <1% | <1% | 54% |
| 20 | Sunderland | 9 | 5 | 37.5 | <1% | <1% | 55% |
Sorted by expected final points. P and Pts are the table on 2 Nov, when the forecast ran.
Finishing position probabilities
Chance (%) of finishing in each position. Darker = more likely; blank = under 1%.
| Club | 1 | 2 | 3 | 4 | 5 | 6 | 7 | 8 | 9 | 10 | 11 | 12 | 13 | 14 | 15 | 16 | 17 | 18 | 19 | 20 |
|---|---|---|---|---|---|---|---|---|---|---|---|---|---|---|---|---|---|---|---|---|
| Arsenal | 62 | 28 | 7 | 2 | 1% | <1% | <1% | <1% | <1% | <1% | <1% | <1% | <1% | <1% | <1% | <1% | <1% | <1% | <1% | <1% |
| Manchester City | 31 | 45 | 15 | 6 | 2 | 1% | <1% | <1% | <1% | <1% | <1% | <1% | <1% | <1% | <1% | <1% | <1% | <1% | <1% | <1% |
| Brighton | 4 | 13 | 30 | 22 | 13 | 8 | 5 | 3 | 2 | 1 | 1% | <1% | <1% | <1% | <1% | <1% | <1% | <1% | <1% | <1% |
| Liverpool | 2 | 9 | 23 | 23 | 15 | 10 | 6 | 4 | 3 | 2 | 1 | 1% | <1% | <1% | <1% | <1% | <1% | <1% | <1% | <1% |
| Chelsea | 1% | 3 | 10 | 15 | 17 | 14 | 10 | 8 | 7 | 4 | 3 | 3 | 2 | 1 | 1% | 1% | <1% | <1% | <1% | <1% |
| Brentford | <1% | 1 | 4 | 8 | 12 | 13 | 12 | 10 | 9 | 7 | 6 | 5 | 4 | 3 | 2 | 2 | 1% | 1% | <1% | <1% |
| Aston Villa | <1% | 1% | 3 | 7 | 10 | 11 | 11 | 11 | 9 | 8 | 7 | 6 | 5 | 4 | 3 | 2 | 2 | 1 | 1% | <1% |
| Newcastle United | <1% | 1% | 2 | 6 | 8 | 10 | 11 | 10 | 10 | 8 | 8 | 7 | 5 | 5 | 3 | 3 | 2 | 1 | 1% | <1% |
| Bournemouth | <1% | <1% | 2 | 5 | 8 | 10 | 10 | 11 | 9 | 8 | 8 | 6 | 6 | 5 | 4 | 3 | 2 | 1 | 1% | <1% |
| Tottenham Hotspur | <1% | <1% | 1% | 2 | 3 | 4 | 6 | 7 | 8 | 8 | 9 | 8 | 9 | 8 | 7 | 6 | 5 | 4 | 3 | 2 |
| Leeds United | <1% | <1% | <1% | 1 | 3 | 4 | 5 | 7 | 7 | 8 | 8 | 9 | 9 | 8 | 7 | 6 | 6 | 5 | 3 | 2 |
| Manchester United | <1% | <1% | 1% | 1 | 2 | 4 | 6 | 6 | 7 | 8 | 8 | 9 | 8 | 8 | 8 | 7 | 6 | 5 | 4 | 2 |
| Everton | <1% | <1% | <1% | 1 | 2 | 3 | 4 | 6 | 7 | 8 | 8 | 8 | 9 | 8 | 8 | 8 | 6 | 6 | 5 | 3 |
| Hull City | <1% | <1% | <1% | <1% | 2 | 3 | 4 | 5 | 6 | 7 | 7 | 8 | 9 | 9 | 8 | 8 | 7 | 6 | 5 | 3 |
| Fulham | <1% | <1% | <1% | 1% | 1 | 2 | 4 | 4 | 5 | 7 | 7 | 8 | 9 | 9 | 9 | 9 | 8 | 7 | 6 | 4 |
| Coventry City | <1% | <1% | <1% | <1% | 1% | 1 | 2 | 3 | 3 | 4 | 5 | 6 | 7 | 8 | 9 | 9 | 11 | 11 | 10 | 9 |
| Nottingham Forest | <1% | <1% | <1% | <1% | 1% | 1 | 2 | 3 | 3 | 5 | 6 | 6 | 7 | 8 | 9 | 11 | 10 | 11 | 10 | 8 |
| Crystal Palace | <1% | <1% | <1% | <1% | <1% | 1% | 1% | 1 | 2 | 3 | 4 | 4 | 5 | 6 | 8 | 9 | 11 | 13 | 16 | 16 |
| Ipswich Town | <1% | <1% | <1% | <1% | <1% | <1% | 1% | 1% | 1 | 2 | 3 | 3 | 4 | 5 | 7 | 8 | 11 | 13 | 17 | 23 |
| Sunderland | <1% | <1% | <1% | <1% | <1% | <1% | <1% | 1% | 1 | 2 | 2 | 3 | 4 | 5 | 7 | 9 | 10 | 14 | 17 | 25 |
Movement this week
- Coventry City+4.1 ptsTitle ±0 · Top 4 ±0 pp
- Brighton+2.9 ptsTitle +2 · Top 4 +13 pp
- Arsenal+1.9 ptsTitle +15 · Top 4 +1 pp
- Manchester City−2.7 ptsTitle −16 · Top 4 −2 pp
- Leeds United−2.2 ptsTitle ±0 · Top 4 −2 pp
- Sunderland−2.1 ptsTitle ±0 · Top 4 ±0 pp
Change in expected points since the run on 26 Oct, with title and top-four chances in percentage points (pp).
Frozen pre-season forecast
It was calculated on 2 Nov 2026 using only data from before matchday 1 (results before 19 Aug 2026). We started covering the Premier League after the season had begun, so no table was published before kick-off. It has been frozen since then and never updated. We grade it against the final table when the season ends. Frozen cb9109d9479d
| # | Club | Exp. pts | Title | Now |
|---|---|---|---|---|
| 1 | Arsenal | 76.5 | 43% | 1st |
| 2 | Manchester City | 76.4 | 42% | 2nd |
| 3 | Liverpool | 66.5 | 9% | 5th |
| 4 | Newcastle United | 57.5 | 1% | 13th |
| 5 | Chelsea | 57.2 | 1% | 4th |
| 6 | Manchester United | 57.0 | 1% | 17th |
| 7 | Aston Villa | 56.7 | 1% | 10th |
| 8 | Brighton | 54.8 | 1% | 3rd |
| 9 | Brentford | 54.2 | 1% | 6th |
| 10 | Bournemouth | 53.8 | <1% | 8th |
| 11 | Nottingham Forest | 51.5 | <1% | 19th |
| 12 | Fulham | 50.3 | <1% | 15th |
| 13 | Tottenham Hotspur | 49.5 | <1% | 9th |
| 14 | Everton | 48.6 | <1% | 7th |
| 15 | Crystal Palace | 48.4 | <1% | 18th |
| 16 | Sunderland | 48.4 | <1% | 20th |
| 17 | Leeds United | 47.4 | <1% | 12th |
| 18 | Hull City | 34.9 | <1% | 11th |
| 19 | Coventry City | 34.9 | <1% | 16th |
| 20 | Ipswich Town | 27.2 | <1% | 14th |
Share and cite
Free to reuse with a link back (CC BY 4.0). The image and data update every Monday.
FAQ
Who will win the Premier League 2026/27?
Our simulations make Arsenal favourites at 62%, ahead of Manchester City (31%) and Brighton (4%). Even at 62%, the favourite misses out about 38% of the time.
Who will finish in the top four?
Highest top-four chances: Arsenal 99%, Manchester City 97%, Brighton 68%, Liverpool 57%.
How is the predicted table calculated?
We play the rest of the season 10,000 times with the goal model behind our match forecasts, adding random noise to every club’s ratings in each run, and count how often each club finishes in each position. Expected points are the average final total.
How accurate is the pre-season forecast?
It was calculated on 2 Nov 2026 using only data from before matchday 1 (results before 19 Aug 2026). We started covering the Premier League after the season had begun, so no table was published before kick-off. It has been frozen since then and never updated. Its SHA-256 hash is public. When the season ends we publish how far each club finished from its predicted position, misses included.
For information and entertainment only. Not betting advice. 18+. Predictions are probabilities, not certainties. Responsible gambling